
Monthly Close Checklist: Tighten Your Month-End Close
Streamline your month-end accounting with our monthly close checklist. Reduce errors and close faster with proven best practices.
Most business owners have financial data sitting right in front of them but don’t know what to do with it. The numbers exist, but the strategy doesn’t follow.
At My CPA Advisory and Accounting Partners, we’ve seen how financial insights for growth transform companies that take action on their data. When you understand your spending patterns, revenue trends, and cost opportunities, you stop guessing and start deciding.
Your spending patterns reveal far more than what you’re paying for-they expose where money disappears without generating returns. Most business owners never analyze their expense breakdown deeply enough to spot redundancies, overspending on tools no one uses, or subscriptions that should have been cancelled years ago. When you track expenses by category and compare them month-to-month, patterns emerge that surprise most owners.
A manufacturer discovered they were paying for three separate software licenses that performed the same function, costing them nearly $8,000 annually. That money sat on the table, unnoticed, until someone looked at the data. Redundant tools, unused features, and forgotten subscriptions drain cash that could fuel growth. The fix starts simple: categorize every expense and track it over time. You’ll spot the waste that your gut never caught.
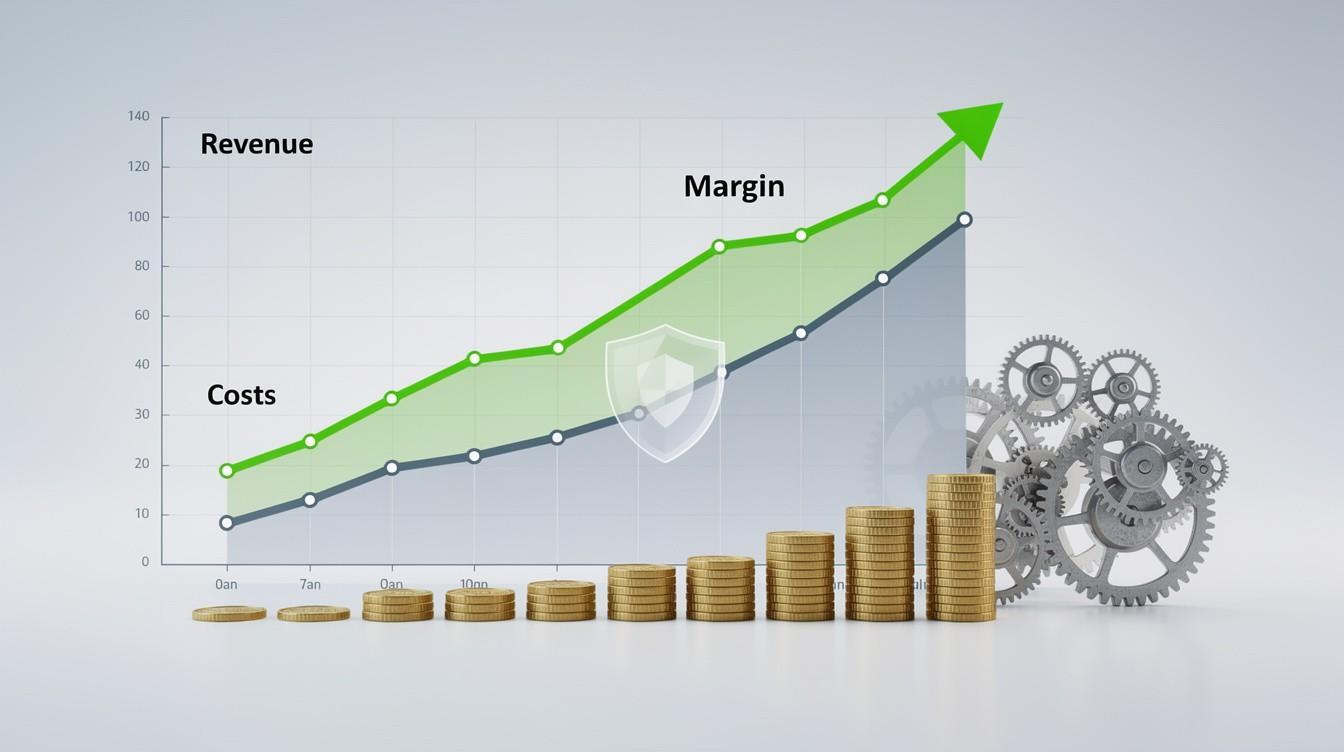
Revenue trends matter, but not in the way most think. Looking at total revenue tells you almost nothing about health-you need to know which products or service lines actually drive profit. A business generating $2 million in revenue might be far less healthy than one generating $800,000 if the first spends $1.8 million to earn those dollars. Profitability by product, customer segment, or service line reveals which parts of your business pull their weight and which drain resources.
Real-world data shows that many companies discover their top revenue generator is actually their lowest-margin business, while smaller revenue streams deliver disproportionate profit. That insight alone changes pricing strategy, marketing spend allocation, and even which customers you pursue.
Cost reduction isn’t about cutting everywhere-it’s about cutting where you won’t damage growth. The problem with most cost-cutting efforts is they’re reactive and indiscriminate. When cash gets tight, owners slash across the board and hope for the best. That approach kills growth engines you didn’t realize mattered.
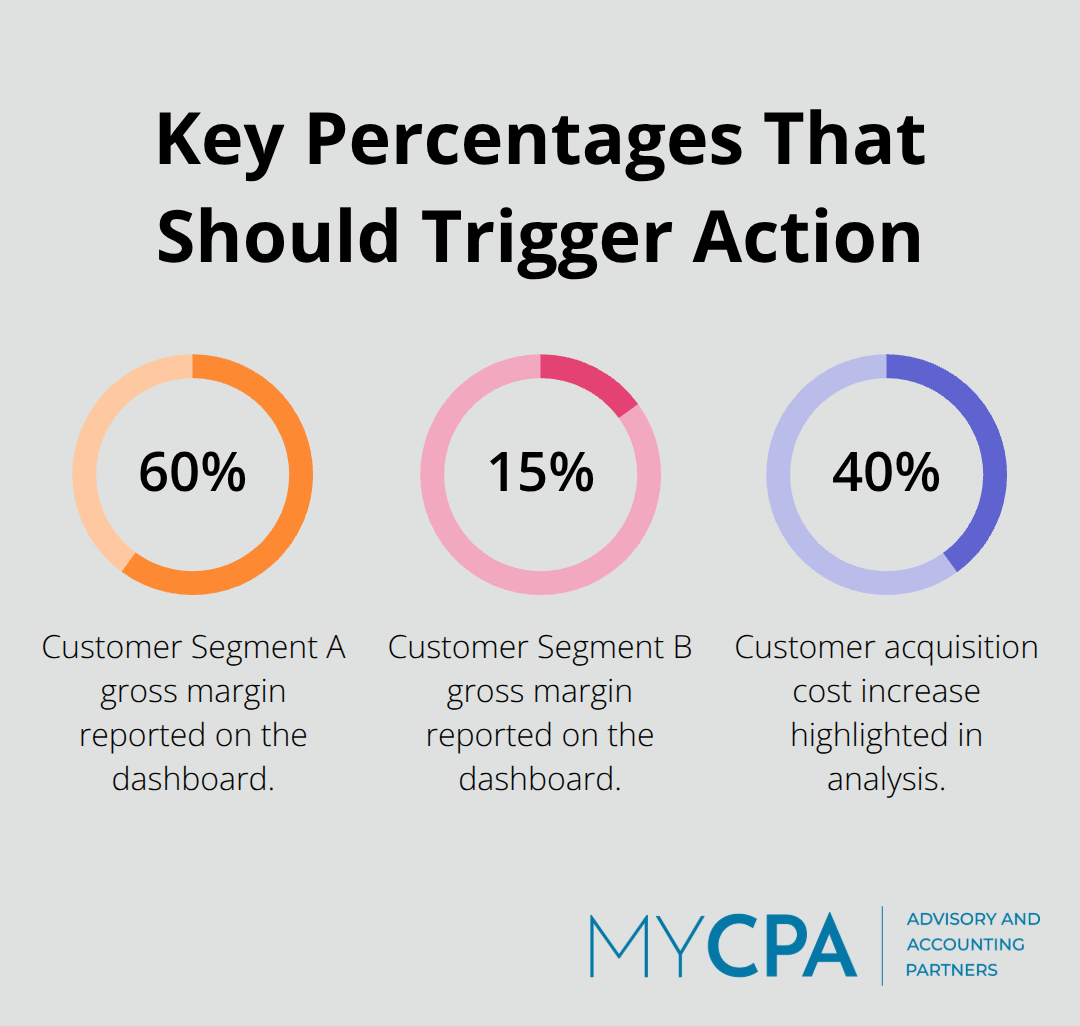
Instead, granular financial analysis shows exactly where costs sit relative to revenue and profit contribution. You might find that your customer acquisition cost has crept up 40% while your average customer lifetime value dropped, signaling a pricing or market shift problem. Or you discover that a specific service line requires triple the overhead of another, making it a candidate for restructuring or elimination. These decisions require data, not gut feel.
Without clear visibility into these relationships, you operate blind, and cost-cutting becomes guesswork that often damages the wrong areas. The next step is learning how to transform this raw financial data into decisions that actually move the needle.
Raw financial data only matters if you act on it. The gap between having data and using it separates growing companies from stagnant ones. Most business owners collect numbers but fail to organize them in a way that actually drives decisions. The first step is ruthless organization. Your accounting software must categorize every transaction consistently, month after month. If your chart of accounts is messy or categories shift, you’ll spot false patterns and miss real ones. Clean your data before you analyze it.
Once organized, calculate metrics that matter to your specific business. Revenue per employee tells you something different than revenue per customer or revenue per location. Gross margin by product line reveals which offerings actually work. Cash conversion cycle length exposes how long money sits in operations before returning to your bank account. The metrics that drive decisions are specific to your business model, not generic ratios you find in textbooks. Most companies track the wrong metrics and wonder why their financial insights don’t help them decide anything.
The test of useful financial analysis is simple: does it change what you do? If your dashboard shows that Customer Segment A has 60% gross margin while Segment B has 15%, that should trigger decisions about pricing, service delivery, or which customers you pursue. If your analysis reveals that accounts receivable days stretched from 35 to 52 days, you need to know why and act on it immediately, because that’s cash sitting somewhere it shouldn’t be.
Many finance teams produce beautiful reports that nobody acts on because the reports answer questions nobody asked. Before you build any dashboard or analysis, ask yourself what decision it will inform. If you can’t answer that question, don’t build it.
Real financial insights connect three things: the metric, the root cause, and the action. You find that marketing spend per customer acquisition jumped 40% quarter-over-quarter. That’s the metric. Digging deeper, you discover your best-performing ad channel raised rates and your conversion rates declined slightly. That’s the root cause.
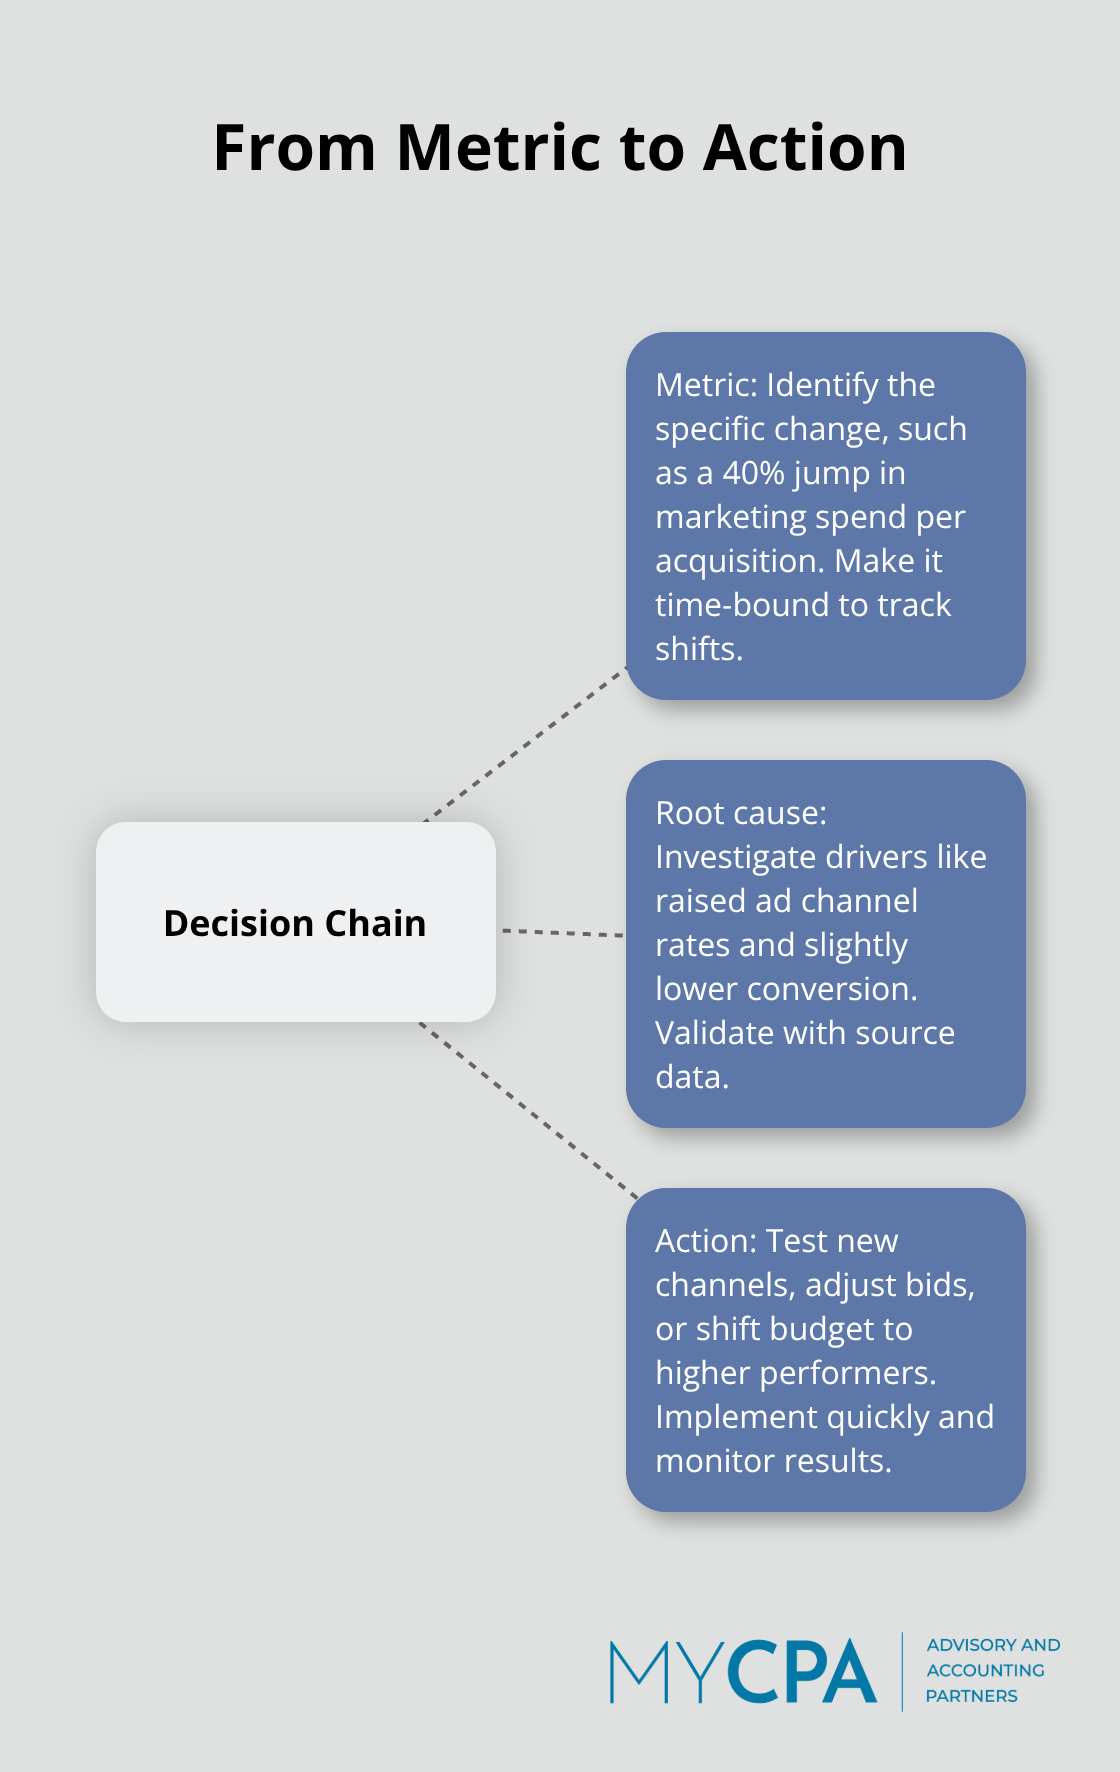
The action becomes clear: test new channels, adjust bid strategies, or shift budget to higher-performing segments. Without that full chain, you have data but no direction.
This structured approach transforms raw numbers into decisions that move your business forward. The next step is selecting the right tools and systems that make this analysis fast, accurate, and repeatable across your entire operation.
The tools you select determine whether financial analysis becomes a regular business habit or a one-time project that never repeats. Most business owners already have accounting software, but they treat it as a record-keeping system rather than a decision-making engine. Your accounting platform must integrate tightly with your banking, payroll, and operational systems so data flows automatically without manual entry. When you manually pull numbers from five different systems, analysis becomes too slow to matter. QuickBooks Online, Xero, and MYOB all integrate with banking feeds and third-party apps, reducing entry errors and keeping data current. The real question isn’t which software to pick-it’s whether you actually use your existing software to its full capacity. Most businesses operate at 30% of their accounting platform’s capability because they never move past basic transaction entry.
Start with mapping every metric you identified as decision-critical in the previous step, then configure your software to automatically calculate those metrics every month. If your software can’t calculate it natively, use integrations or middleware tools to bridge the gap. This automation transforms analysis from an annual event to a monthly habit, which changes everything about how quickly you respond to business shifts. Your accounting system should feed directly into your reporting structure without manual intervention. When calculations happen automatically, you spot trends faster and act on them before competitors do.
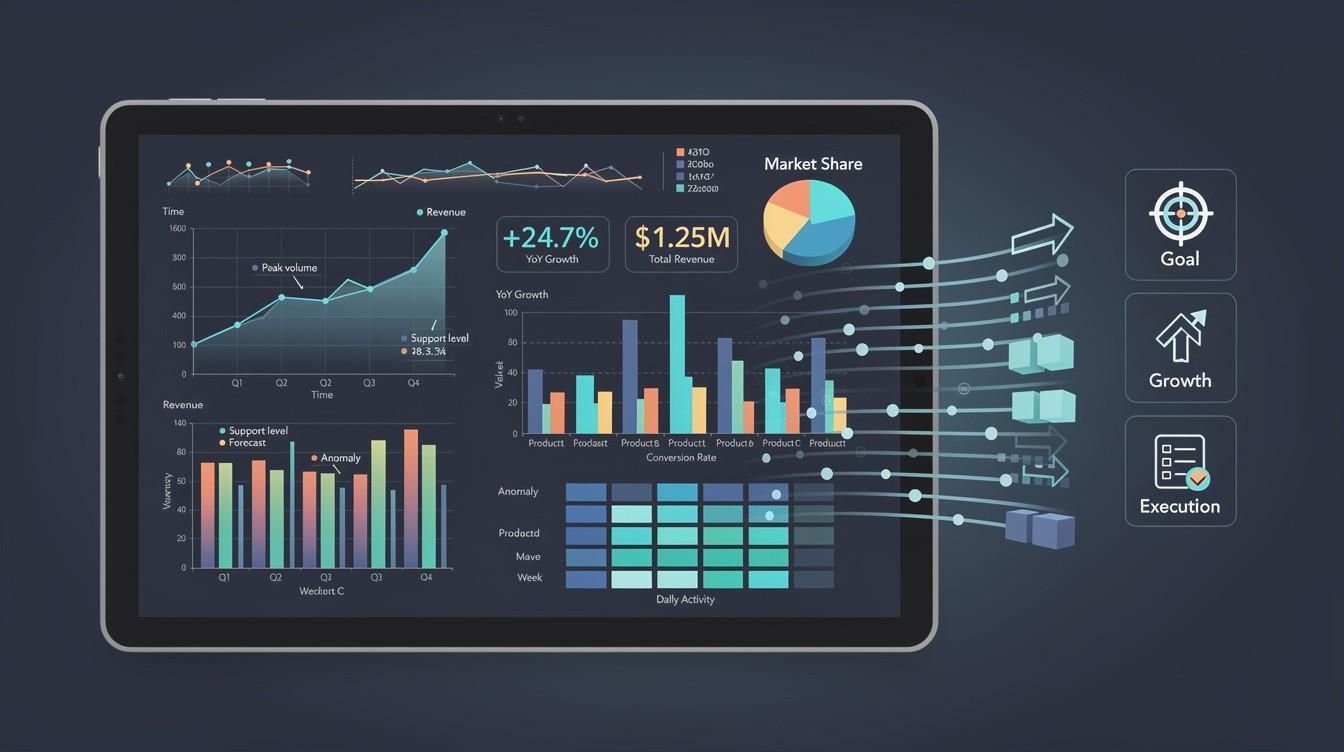
Static monthly reports arrive too late to matter. When you finally see last month’s cash position on the 15th of this month, you’ve already made decisions based on incomplete information. Dashboard tools like Tableau, Power BI, and Looker connect directly to your accounting data and update continuously, showing you current cash position, aging receivables, expense trends, and margin performance as they happen. Real-time dashboards and continuous financial tracking are driving business transformation, with the real-time analytics market expected to reach USD 193.71 billion by 2032. That shift reflects what’s actually happening in practice: companies that can see their numbers in real time make faster, better decisions.
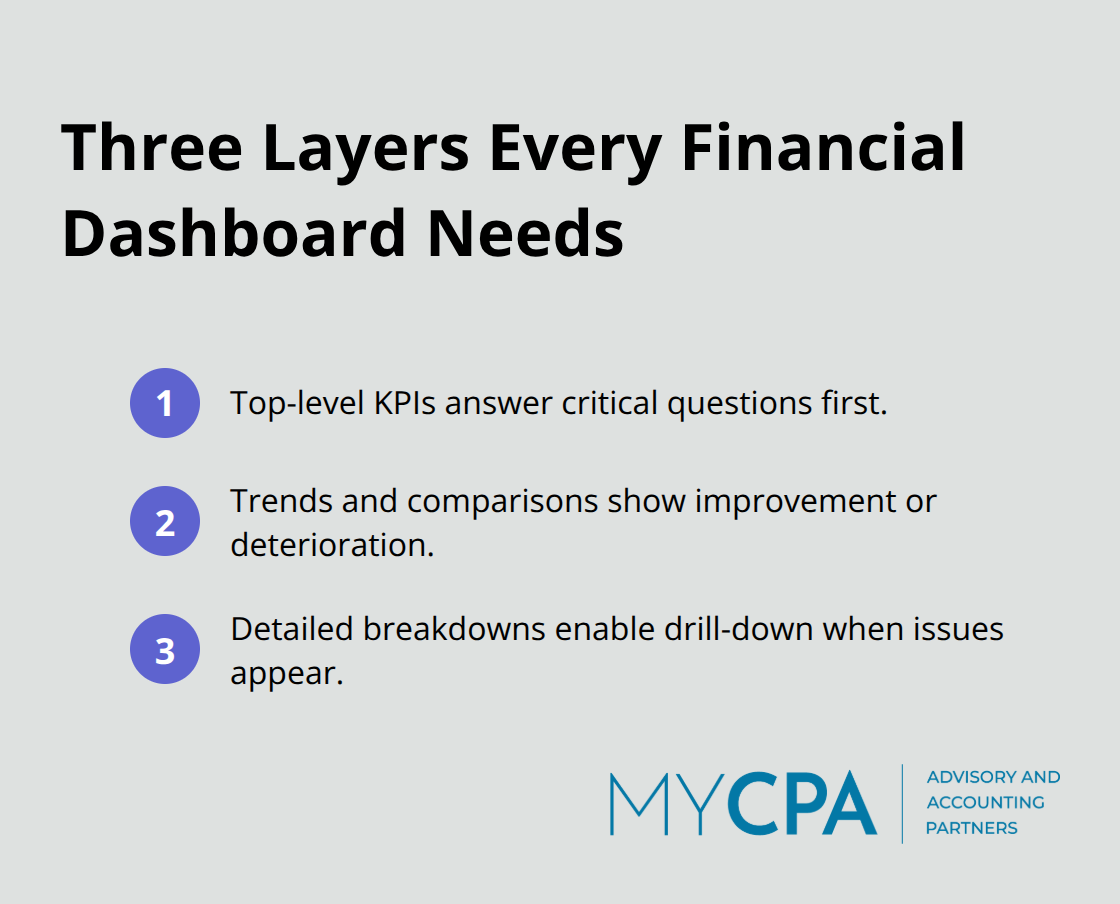
Your dashboard should show three layers of information: top-level KPIs that answer your critical business questions first, followed by trends and comparisons that show whether metrics are improving or deteriorating, then detailed breakdowns that let you drill down into specifics when you spot a problem. Most dashboards fail because they show everything equally, overwhelming users with data instead of guiding them to what matters.
Tailor your dashboard to the specific questions your leadership team needs answered weekly. A manufacturing company needs different dashboards than a professional services firm, and your dashboard must reflect your actual business model and decision rhythm.
The hardest part of financial analysis isn’t collecting data or building dashboards-it’s translating what the numbers mean into specific business actions. Many owners look at their metrics and still don’t know what to do. A dashboard showing that customer acquisition cost rose 35% doesn’t automatically tell you whether to increase prices, cut marketing spend, shift channels, or accept lower margins temporarily. That interpretation requires experience with your industry, understanding of your cost structure, and knowledge of market conditions.
Proactive advisory strategies for business growth separate growing companies from stuck ones. When you work with a skilled advisor, they interpret your financial data in the context of your specific business model and market position, connecting metrics to the decisions that actually move your company forward. A skilled advisor asks the questions that expose root causes: Did acquisition cost rise because your best-performing channel raised rates, because your conversion rates declined, or because you’re pursuing lower-quality leads? Each answer points to different actions. Many business owners try to interpret their own data and reach wrong conclusions that lead to harmful decisions. The cost of that mistake-cutting a profitable service line or abandoning a good customer segment-far exceeds the cost of professional guidance. Start with a financial advisor who understands your industry and can translate your numbers into a clear action plan tied to your growth goals.
Financial insights for growth only matter when you act on them. Most business owners collect financial data but never move beyond reporting-they see the numbers arrive each month and file them away. The companies that pull ahead treat financial analysis as a continuous decision-making process, not a compliance requirement. When your dashboard shows accounts receivable stretched to 52 days, you investigate immediately. When profitability analysis reveals that your largest revenue stream carries the lowest margin, you adjust pricing or service delivery right away.
Building a data-driven financial culture starts with leadership commitment. Your team won’t prioritize financial insights if you don’t. When you regularly reference your metrics in meetings, ask questions about trends, and make decisions based on data rather than intuition, everyone else follows. Start small with one critical metric that directly impacts your growth, track it weekly, and act on what it shows. Success with that single metric builds momentum and credibility for expanding your financial analysis across the entire business.
At My CPA Advisory and Accounting Partners, we help business owners transform financial data into strategic moves that accelerate growth. Our tailored financial services include accounting, tax optimization, and business advisory that connects your numbers to your actual business decisions. The right financial partner interprets your data in context, asks the questions that expose root causes, and guides you toward actions that move your company forward.


Privacy Policy | Terms & Conditions | Powered by Cajabra