
Data Driven Growth: Turning Insights Into Scale
Leverage data-driven growth strategies to scale your business faster. Learn how to transform insights into measurable results.
Most business owners make growth decisions based on gut feeling rather than facts. We at My CPA Advisory and Accounting Partners have seen firsthand how data-driven growth transforms companies-turning scattered numbers into a clear roadmap for scaling.
The difference between sustainable expansion and costly mistakes often comes down to one thing: whether you’re measuring what actually matters. This guide shows you how to identify your key metrics, extract real insights from your data, and use those insights to fuel profitable growth.
Most businesses track too many metrics and understand too few of them. Companies monitor dozens of data points without knowing which ones predict revenue, cash flow, or profitability. Start with three to five metrics that directly connect to your bottom line. The most important metrics include revenue growth, gross profit margin, cash flow, customer acquisition cost, and net profit. For a service business, this means revenue per client, client acquisition cost, and gross margin. For a product company, track unit economics, customer lifetime value, and repeat purchase rate.
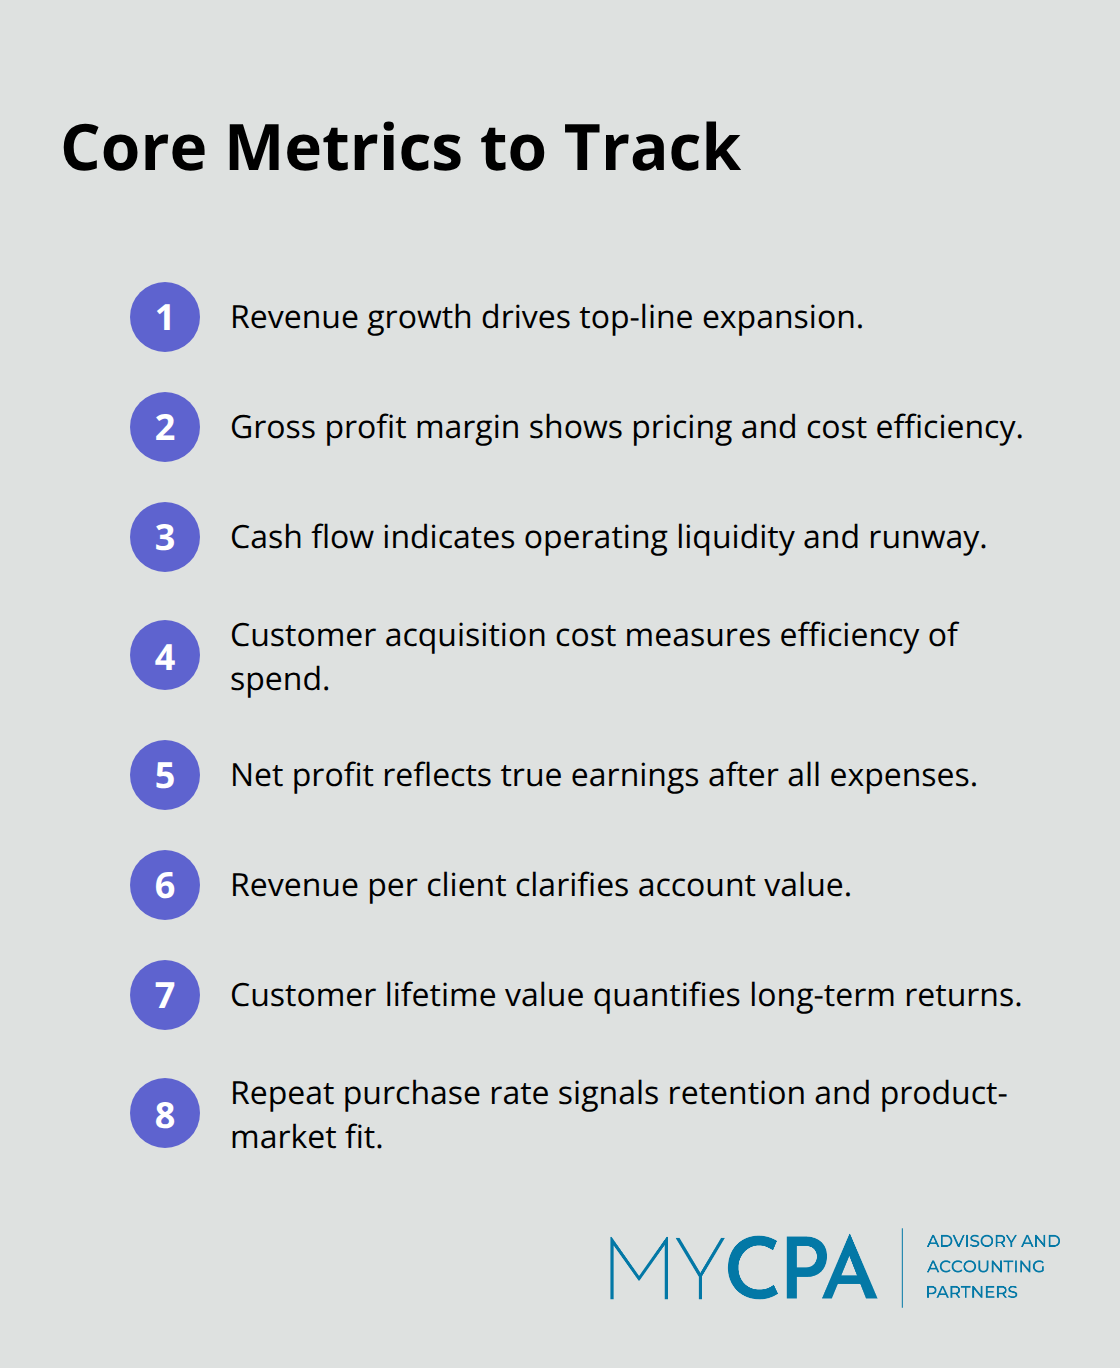
These metrics answer a single question: Is this business becoming more profitable and sustainable?
Once you identify core indicators, set up dedicated tracking systems that capture data automatically rather than relying on manual entry. Integrate your accounting software with your CRM, payment processor, and operational tools so numbers flow continuously into a central location. Poor data quality creates costly decisions, so implement validation checks that flag inconsistencies, duplicate entries, or missing values immediately. This integration eliminates gaps and ensures your team works from the same numbers.
Establish baseline measurements for each metric before you make any changes to your business. A baseline shows where you stand today and becomes the reference point for measuring growth. If your gross margin sits at 45%, that’s your baseline. If customer acquisition cost runs at $500, document it. These starting numbers matter because they let you quantify the impact of any strategy change. Without baselines, you cannot distinguish between normal fluctuation and meaningful improvement.
Track these baselines monthly for at least three months to account for seasonal patterns and irregular months (most businesses experience revenue swings tied to seasons or market cycles). This extended observation period reveals what normal looks like for your operation. Once you understand your baseline, you can spot real trends versus temporary blips. This foundation transforms raw data into a language your business understands and prepares you to extract insights that actually move the needle.
Your baseline metrics sit in front of you now. Revenue per client, gross margin, customer acquisition cost-the numbers are there. The mistake most business owners make at this stage is treating data as a report to file away rather than a tool to act on. The gap between data and action is where most growth stalls.
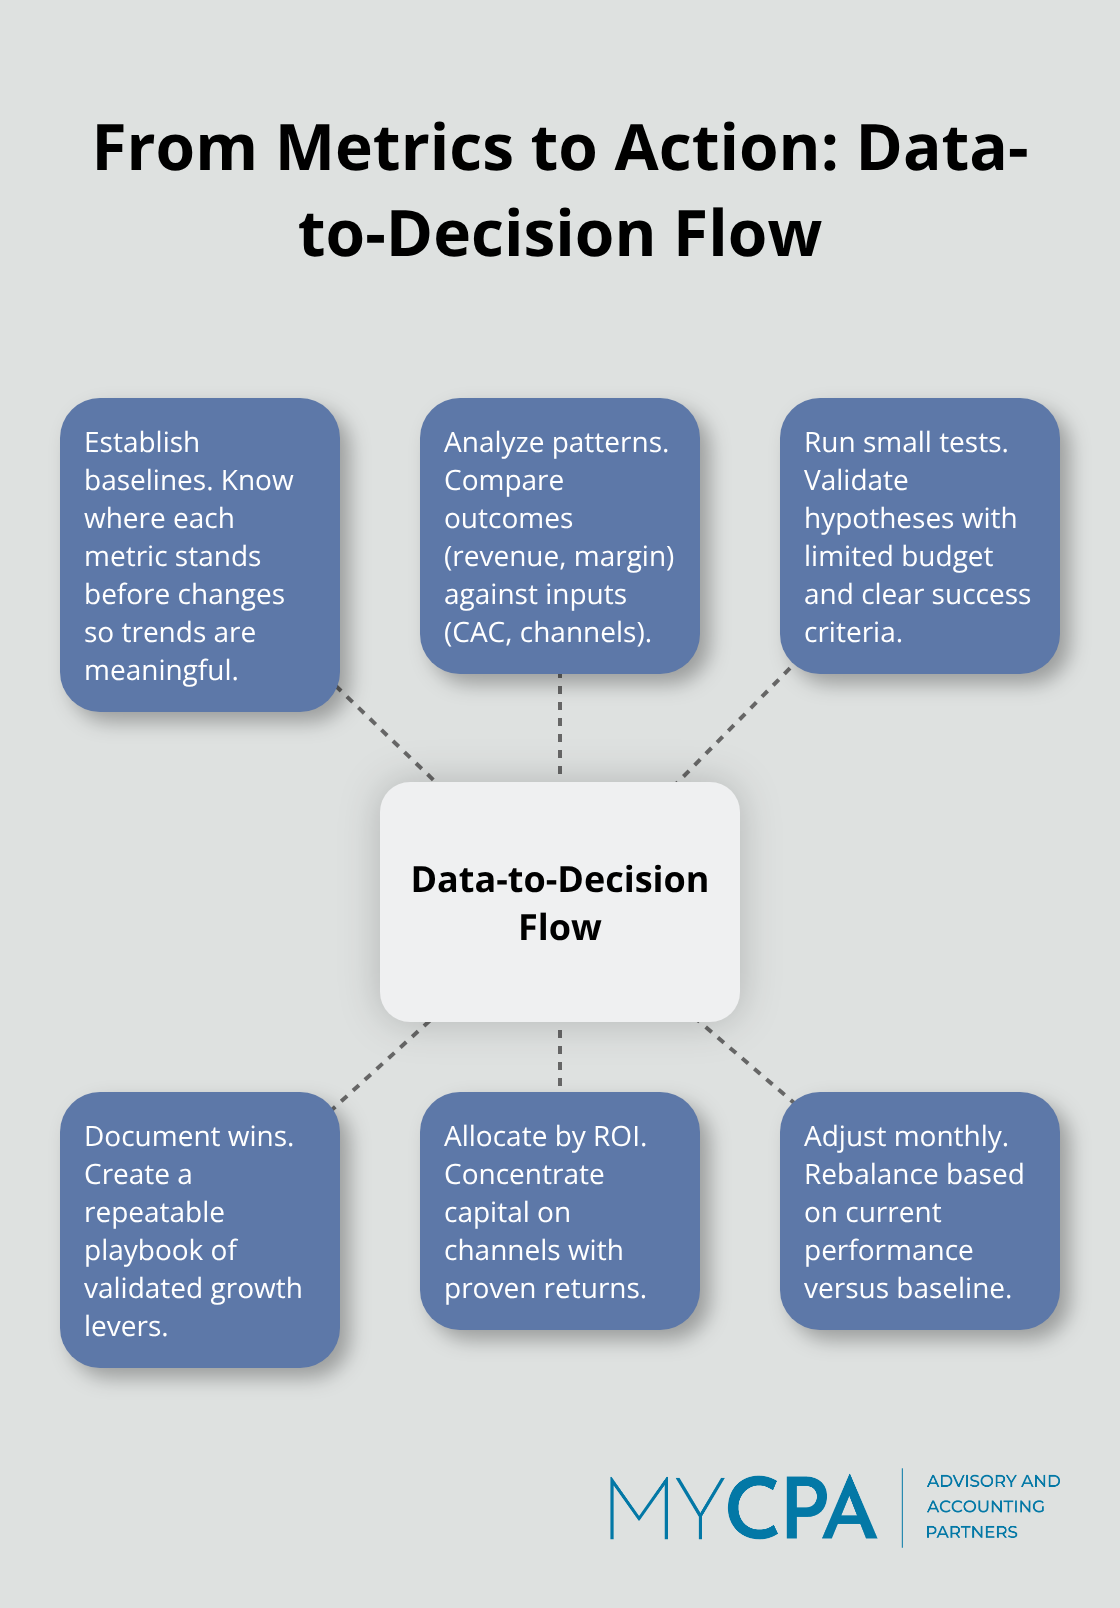
You need a systematic way to move from observation to decision, and that process starts with pattern recognition tied directly to your financial outcomes.
Look at your revenue and gross margin over the past three to six months. Where did revenue spike? What was different about that period? Did you acquire more customers, increase average transaction value, or expand into a new market segment? Cross-reference revenue spikes against your customer acquisition data.
If revenue jumped 15% in month two but customer acquisition cost remained flat, you found leverage-your existing marketing channels worked harder that month, or a specific campaign performed better than baseline. This matters because it tells you where to double down. Conversely, when revenue dips below baseline while acquisition costs climb, you have a profitability problem masquerading as a growth problem. Your acquisition engine burns cash without proportional return, and scaling this operation would compound losses. The pattern analysis stops guesswork cold because it forces you to compare outcomes against inputs.
Once patterns emerge, test patterns before committing budget to full-scale implementation. If data suggests that customers acquired through LinkedIn referrals have higher lifetime value than those from paid search, run a small experiment: increase LinkedIn outreach by 20% for one month while holding other channels constant. Measure the results against your baseline. Does the pattern hold? If yes, you have validated a growth lever backed by numbers, not intuition. If no, the data revealed a correlation that doesn’t translate to causation-and you learned that without risking the entire marketing budget.
This hypothesis-testing approach is how companies like Amazon operate at scale. Amazon’s AI-driven inventory optimization reduced stockouts while minimizing excess stock, but the system was tested incrementally across regions before company-wide deployment. The principle is identical at smaller scale: small tests validate patterns before major allocation decisions.
Document every test result. What hypothesis did you test? What did you predict? What actually happened? This record becomes your operating manual. After five or ten validated tests, you have a portfolio of proven growth levers specific to your business, not generic advice from business blogs. These validated patterns form the foundation for the next critical step: allocating resources strategically to the channels and strategies that actually work for your operation.
Your tested patterns now sit in front of you with real numbers attached. Revenue jumped 15% when you shifted budget to LinkedIn. Customer lifetime value climbed 22% when you focused on a specific market segment. These validated insights give you permission to allocate serious resources, but most business owners still spread money thin across multiple channels instead of concentrating firepower on what works. This is the moment where data-driven growth either accelerates or stalls. The discipline required here is uncomfortable because it means saying no to opportunities that look promising but lack proof.
You cannot scale everything at once, and attempting to do so dilutes the impact of your highest-performing levers. Start by ranking your validated patterns by return on investment. If LinkedIn outreach generates customers at $300 per acquisition while paid search costs $520 per customer, and both channels drive similar lifetime value, the math is clear: increase LinkedIn allocation and reduce paid search. Walmart’s AI-driven inventory optimization demonstrates this principle across operations, reducing stockouts by aligning stock with actual demand signals rather than spreading inventory evenly across all products. Your resource allocation works the same way. Concentrate budget on the channels and strategies that delivered the highest return in your tests, then scale those levers incrementally.
Growth that erodes profitability is expensive failure wearing a growth disguise. Many business owners watch gross margin collapse as they scale because they fail to monitor the relationship between revenue growth and actual profit dollars. If revenue grows 30% but gross margin falls from 48% to 41%, you are generating more sales from lower-quality customers or higher-cost operations. This matters because it reveals whether growth is sustainable or whether you are buying market share at the cost of future viability.
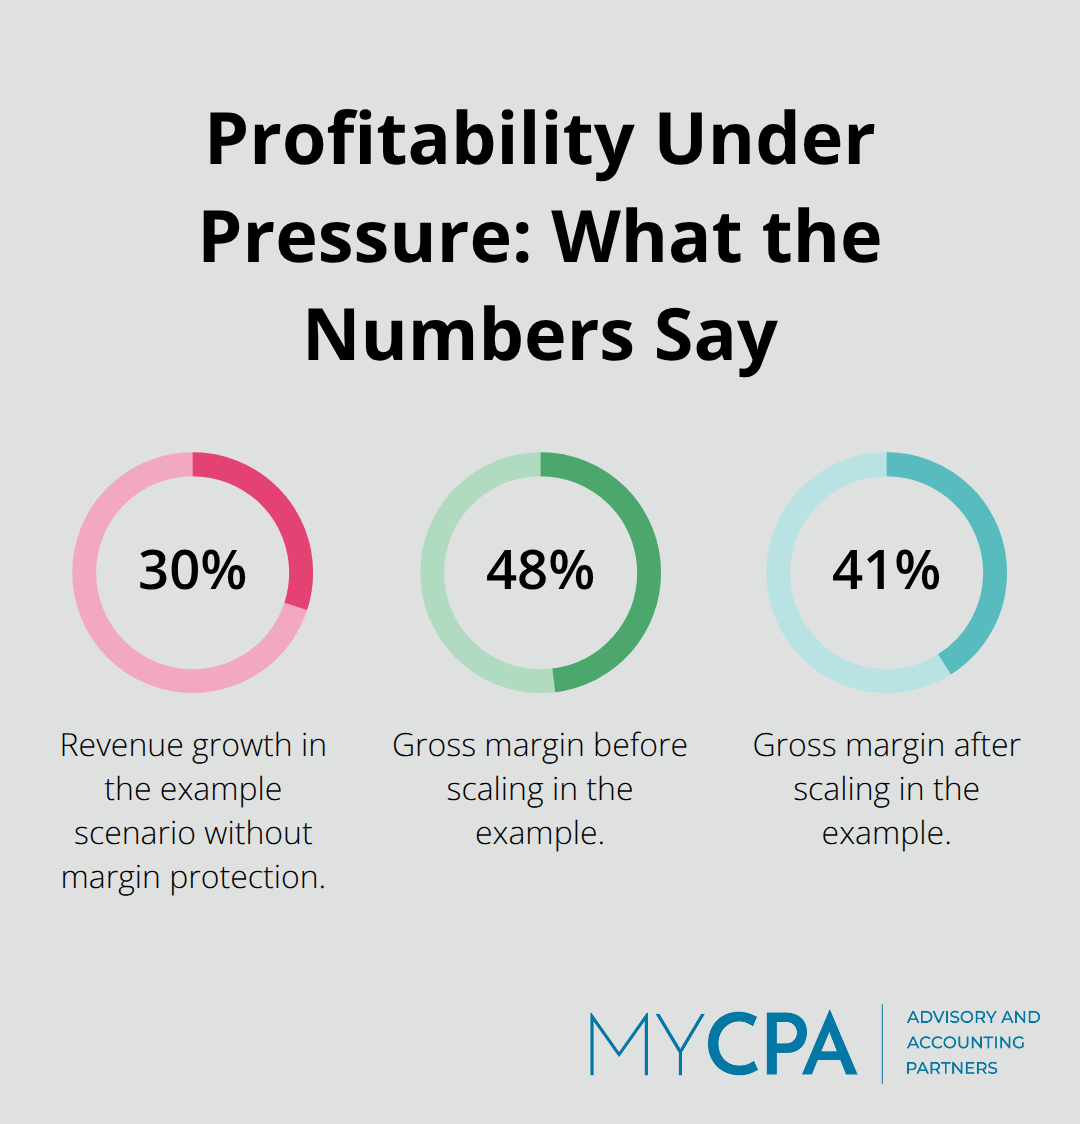
Track gross profit in dollars, not just as a percentage. A 48% margin on $100,000 monthly revenue generates $48,000 gross profit. A 41% margin on $130,000 revenue generates $53,300 gross profit, which looks like progress until you account for the operational complexity and cash flow strain that comes with serving lower-margin customers. Protect profitability while scaling by monitoring how bad debt impacts working capital and your ability to operate confidently. You acquire more customers, your accounts receivable balloon, and suddenly you cannot meet payroll despite higher revenue.
Implement weekly cash flow monitoring during periods of rapid growth, not monthly reviews. Track days sales outstanding to see how long customer payments actually take. If your average customer takes 45 days to pay but you need cash weekly to cover operations, you have a timing problem that growth will magnify. Many growing companies fail not because the model is broken but because they ran out of cash before profitability kicked in.
Quarterly reviews of your allocation strategy are not frequent enough when you are scaling. Run monthly performance reviews against the metrics you established at baseline. Compare current performance to both baseline and to the previous month. This cadence catches problems early. If customer acquisition cost climbs 18% month-over-month while conversion rates remain flat, your marketing channels are becoming less efficient, and you need to investigate why before the problem compounds.
Adjust allocation monthly based on what the data shows, not on what you hoped would happen. If a channel that performed well in month one underperforms in month two, reduce allocation and redirect budget to consistent performers. This is not pessimism; this is disciplined capital deployment. Companies like Amazon test and adjust continuously across their logistics network, optimizing delivery routes based on real-time performance data rather than static plans. Your business deserves the same rigor.
Set clear stopping points for underperforming initiatives. If a strategy fails to hit target metrics after two months of scaled investment, cut it. The money you save by killing failing experiments funds expansion of proven winners. This ruthlessness is what separates data-driven companies from those that throw money at problems hoping something sticks.
Data transforms guesswork into strategy, but only when you act on what the numbers reveal. Throughout this guide, you have learned how to identify metrics that matter, extract patterns from your financial data, and allocate resources to what actually works. The framework is straightforward: measure baseline performance, test hypotheses with real numbers, validate patterns before scaling, and adjust allocation based on monthly results. Companies that follow this approach grow sustainably through data driven growth, while those that skip steps or ignore data signals eventually hit a wall.
Continuous monitoring keeps growth sustainable because markets shift, customer behavior changes, and what worked last quarter may not work next quarter. Monthly performance reviews against your baseline metrics catch these shifts early, and weekly cash flow monitoring during rapid growth prevents the cash crunch that kills otherwise healthy businesses. Real-time visibility into your key metrics means you respond to reality, not to outdated reports filed away in spreadsheets.
Data-driven growth requires discipline, but it also requires expertise in accounting systems, tax strategy, and financial planning. If your tax structure is inefficient, growth dollars disappear into unnecessary tax liability, and if your accounting processes are manual and error-prone, your data quality suffers and decisions rest on faulty numbers. We at My CPA Advisory and Accounting Partners work with business owners who are serious about sustainable growth, and we help you structure your business for tax efficiency while maintaining accurate financial reporting that feeds your decision-making.








Privacy Policy | Terms & Conditions | Powered by Cajabra